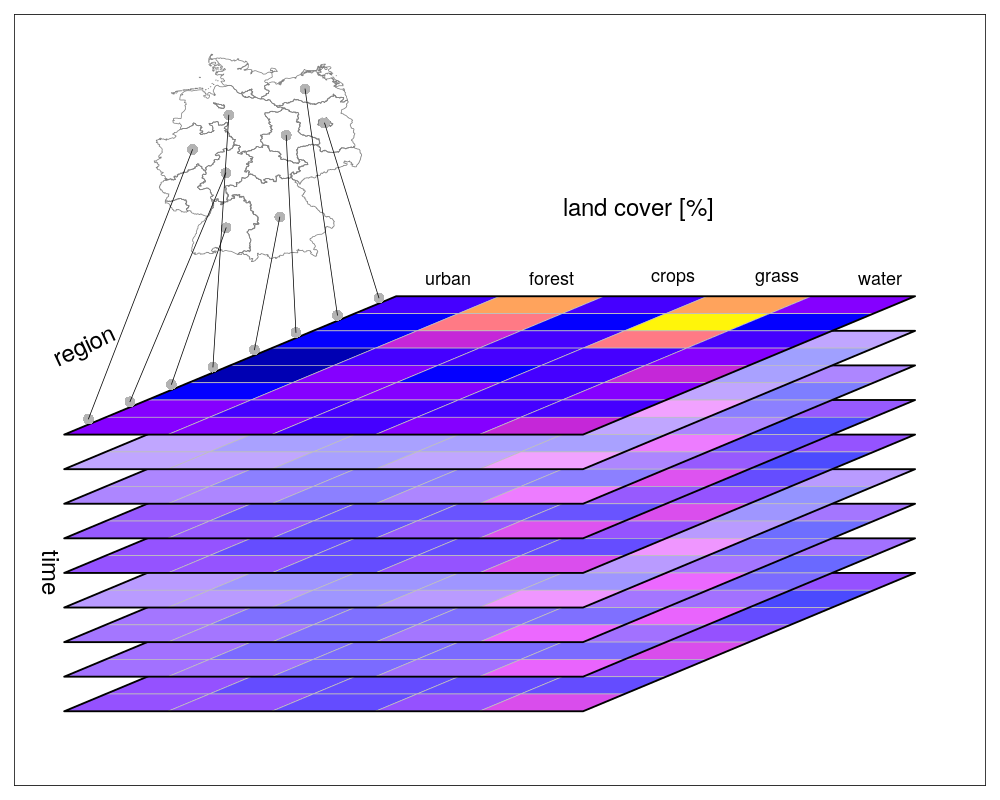
Vector data cubes
Exploration of possible implementation of vector data cubes in Python based on xarray and geopandas. The goal is to mimic what stars package in R can do - https://r-spatial.github.io/stars/articles/stars1.html#vector-data-cube-example
Because we need to use geometries as an index, we need to ensure that geopandas is using shapely 2.0 (beta) as a geometry engine. Shapely 1.8 geometries are not hashable, while shapely 2.0 are.
1 2 3 4 | import geopandas import pandas import xarray import numpy |
We want to recreate this example from stars documentation.
Load geometries using geopandas:
1 | nc = geopandas.read_file("https://github.com/r-spatial/sf/raw/main/inst/gpkg/nc.gpkg") |
Get the GeometryArray. Note that this also contains CRS information at this point.
1 | origin = destination = nc.geometry.array |
Create dimensions and dummy data.
1 2 3 4 | mode = ["car", "bike", "foot"] day = pandas.date_range("2015-01-01", periods=100) hours = range(24) data = numpy.random.randint(1, 100, size=(3, 100, 24, 100, 100)) |
Create xarray.DataArray.
1 2 | arr = xarray.DataArray(data, coords=(mode, day, hours, origin, destination), dims=["mode", "day", "time", "origin", "destination"]) arr |
<xarray.DataArray (mode: 3, day: 100, time: 24, origin: 100, destination: 100)>
array([[[[[ 3, 22, 90, ...,  1, 39, 76],
          [31, 59,  8, ..., 62, 20, 45],
          [23,  1, 21, ..., 88, 37, 35],
          ...,
          [ 4, 43, 45, ..., 55, 44, 46],
          [22, 78, 26, ..., 41,  3, 65],
          [98, 35, 77, ..., 28, 72, 47]],

         [[ 5,  4, 87, ..., 45, 28, 85],
          [58, 81,  9, ..., 29, 35, 46],
          [17, 11, 99, ..., 77, 29, 88],
          ...,
          [30, 37, 17, ...,  1, 69, 82],
          [94, 21,  4, ..., 73, 10, 63],
          [98,  3, 24, ..., 19, 88, 88]],

         [[10, 29, 63, ..., 75,  6, 70],
          [23, 20, 13, ...,  2, 44, 38],
          [60, 19, 98, ..., 40, 11, 17],
          ...,
...
          ...,
          [19, 97, 35, ..., 14, 41, 54],
          [ 7, 16, 64, ..., 29, 75, 74],
          [66, 62, 62, ..., 67, 39, 36]],

         [[61, 63, 53, ..., 63, 40, 85],
          [78, 61, 62, ..., 32, 59, 43],
          [41, 68, 64, ...,  6, 51,  6],
          ...,
          [51, 89, 55, ..., 82, 61, 63],
          [46, 20, 85, ..., 76, 41, 52],
          [77, 68, 81, ..., 40, 75, 99]],

         [[53, 80, 42, ..., 77,  1,  1],
          [78, 76,  2, ..., 51, 64, 11],
          [ 2, 76, 35, ..., 87, 55, 91],
          ...,
          [31, 23,  7, ..., 69,  3, 91],
          [24, 51, 44, ..., 48, 85, 20],
          [81, 49, 65, ..., 46, 77, 31]]]]])
Coordinates:
  * mode         (mode) <U4 'car' 'bike' 'foot'
  * day          (day) datetime64[ns] 2015-01-01 2015-01-02 ... 2015-04-10
  * time         (time) int64 0 1 2 3 4 5 6 7 8 9 ... 15 16 17 18 19 20 21 22 23
  * origin       (origin) object MULTIPOLYGON (((-81.4727554321289 36.2343559...
* destination (destination) object MULTIPOLYGON (((-81.4727554321289 36.23...So far, all seems to work without hiccups out of the box.
Let's try some indexing. We can try to get counts for car on 2015-01-01 at noon from the first polygon to all the other. The resulting object should be a GeoDataFrame-like (one geometry column of all destinations and one data column of counts).
1 2 | s = arr.sel(mode="car", day='2015-01-01', time=12, origin=origin[0]) s |
<xarray.DataArray (destination: 100)>
array([61, 37, 67,  7,  8, 68, 28, 23, 79, 36, 56, 37, 90, 33, 94, 91, 20,
       38, 29, 21, 93, 75, 43, 67, 57,  3, 73, 69, 84, 79, 49, 72, 74, 87,
       94, 31, 11, 86, 42, 72, 53, 93, 19, 42, 81, 36,  7, 80, 24, 21, 89,
        1, 82, 49, 21,  9, 96, 13, 52, 79, 80, 41, 71, 53, 30, 96,  4, 83,
       95, 84,  4, 45, 98, 11, 21,  1, 95, 21, 69, 79, 35, 14, 16, 73, 67,
        9,  1, 47, 28, 17, 41, 59, 98, 77, 90,  6, 99,  5, 53, 24])
Coordinates:
    mode         <U4 'car'
    day          datetime64[ns] 2015-01-01
    time         int64 12
    origin       object MULTIPOLYGON (((-81.4727554321289 36.23435592651367, ...
* destination (destination) object MULTIPOLYGON (((-81.4727554321289 36.23...1 | s.ndim |
1
This would fail with shapely 1.8 but now we are fine. We have one dimensional DataArray indexed by an array of shapely polygons.
We can turn it into a GeoDataFrame and plot the result.
1 2 | gdf = s.to_pandas().reset_index().set_geometry('destination') gdf.plot(0) |
<AxesSubplot: >

The issue is that we have lost the CRS along the way. CRS is stored on a GeometryArray level but when we create DataArray, xarray uses only the underlying numpy array and ignores our custom attribute.
1 | gdf.crs is None |
True
What needs to be done
It seems that the it will not be very complex to implement convenient vector data cubes. We need to figure out:
- CRS handling
- pyproj.CRS class storing the info on the GeometryArray level should be stored on a DataArray level as well (per dimension) and retained all the way back to a geopandas object.
- It may require some custom logic during I/O and figuring out in which case we lose the info. Hopefully, most of it should be doable using xarray attrs. But some custom
to_geopandasmethod may be needed asto_pandasstill uses geometry as an index and that cannot contain CRS. So we need to convert to DataFrame/Series, reset index and create GeoDataFrame to which we pass a CRS stored on a DataArray level.
- Figure out which geometric ops need to be available on an xarray level
- I have to check stars docs to see how the actual data cube interacts with the vector data apart from using them as an index.
- ... and probably more stuff I missed now.